Introduction
Retaining customers is essential for sustainable growth in today's highly competitive business landscape. That’s why churn prediction models are becoming central to modern business strategies. In our previous article, "The Ultimate Guide to Customer Churn Prediction," we explored the strategic impact of customer churn, particularly in highly competitive markets.
As businesses face rising acquisition costs and tighter margins, many increasingly turn to data-driven solutions to anticipate customer behavior and make informed decisions that protect long-term revenue. In this technical guide, we shift from theory to practice, diving deep into how to build a high-performance machine learning model for churn prediction using XGBoost.
As discussed in our previous article, churn prediction involves identifying customers likely to stop using a company's products or services within a given timeframe. This identification allows immediate user intervention, creating a strong basis for proactive retention strategies.
To address this, we implement a machine learning–driven approach using XGBoost, a high-performance gradient boosting algorithm known for its accuracy and scalability. This technical guide walks through the end-to-end process of developing, fine-tuning, and interpreting a churn prediction model using customer data, equipping decision-makers with a proven framework to anticipate risk and act decisively.
Dataset
At Digital Sense, we typically work with proprietary client data, maintaining rigorous data protection standards. For this technical demonstration, we use the open-source, fictional Telco Customer Churn dataset published by IBM. This dataset lets us share our methodology transparently while providing readers with a practical foundation for applying advanced machine learning techniques to customer retention challenges.
The dataset captures diverse features that mirror the data commonly found in production environments. It includes detailed customer service usage attributes, account level, and demographic information.
We proceed directly to model training and evaluation using the cleaned and engineered features from the following Kaggle notebook: Customer Churn Prediction (Ray William). The notebook details the preliminary steps of exploratory data analysis (EDA), data cleaning, and feature engineering.
The following table outlines the fundamental features used for modeling this problem, detailing each feature's name, data type, and relevant insights from the Exploratory Data Analysis (EDA).
Finally, the target variable, labeled “Churn,” identifies whether a customer has left the service (“Yes”) or remained (“No”), offering a clear binary classification outcome for modeling.
Feature Engineering and Data Cleaning Summary
The notebook provides comprehensive details on feature engineering and data cleaning. A summary of the key steps is presented below:
- Missing Values: The 'TotalCharges' column, the unique feature with missing values (11 nulls), was imputed with zeros based on a deduction further detailed in the notebook. No other features needed imputation.
- Feature Dropping: The 'gender' column was excluded from the model. The EDA revealed an equal distribution across genders, suggesting it does not significantly influence churn. Dropping this feature helps simplify the model and mitigate the curse of dimensionality.
- Novel Feature Generation:
- Combined Categorical Features: New features were created by combining 'Senior Citizen' with 'Dependents', 'Partner', 'Contract', 'Tech Support', and 'Payment Method'. 'Partner' and 'Dependents' were also combined.
- Grouped Calculations:
- A new column, 'Contract_totCharges_diff', was introduced, calculated as the disparity between 'TotalCharges' and 'Contract_mean_totCharges', the latter denoting the average 'TotalCharges' aggregated by contract duration.
- A new column, 'PayMethod_monthCharges_diff', was generated by calculating the difference between 'MonthlyCharges' and the average 'MonthlyCharges' for each payment method, PayMeth_mean_monthCharges.
- Categorical Encoding: Ordinal variables were mapped to integers, and nominal variables were transformed using one-hot encoding.
- Class imbalance: Our dataset exhibits significant class imbalance, with churned subscribers representing only a small fraction of total customers. This imbalance poses challenges for predictive modeling. Classification algorithms tend to favor the majority class (retained customers) at the expense of accurately identifying the minority class (churned users) we're most interested in predicting. To address this limitation, we use the Synthetic Minority Oversampling Technique (SMOTE) during model training, which generates synthetic examples of churned customers to balance the dataset and improve our model's ability to detect churn patterns.
Model Training
Why XGBoost and how it works?
We use an XGBoost classifier due to its high predictive accuracy, scalability to large datasets, and practical interpretability. It handles structured data problems like churn prediction by effectively capturing complex, non-linear relationships between input features and outcomes while maintaining computational efficiency.
At its core, XGBoost is a gradient boosting algorithm, which means it builds an ensemble of decision trees iteratively. It starts with a weak base learner—typically a shallow decision tree—that provides an initial prediction. Then, it builds additional trees that are specifically trained to correct the errors made by the previous ones. This step-by-step refinement process is what gives gradient boosting its strength. Each tree added to the ensemble focuses on the residuals (the mistakes) of the combined model so far, gradually reducing the overall error.
What sets XGBoost apart is that it incorporates regularization directly into its optimization process. Regularization penalizes overly complex models, helping prevent overfitting and encouraging the model to generalize better to unseen data. Additionally, XGBoost has built-in mechanisms for handling missing data, automatically learning the best way to split observations even when some values are missing. This saves preprocessing effort and often yields better results than manual imputation.
In summary, XGBoost is a robust choice because it balances flexibility, accuracy, and efficiency while offering built-in solutions to common data science challenges.
Hyperparameter Tuning with Hyperband
To optimize the performance of our models, we employed Hyperband, introduced by Li et al. (2018), an advanced hyperparameter tuning algorithm that improves both the speed and efficiency of the search process compared to traditional approaches like grid or random search. Hyperband is particularly effective because it intelligently allocates computational resources, tests many hyperparameter combinations briefly, and invests more effort only in the most promising ones.
While traditional methods treat all hyperparameter combinations equally (regardless of performance), Hyperband learns from poor configurations early on and avoids wasting time on them. This allows it to explore a wider search space while remaining computationally efficient, making it a powerful tool when tuning complex models like XGBoost.
We used HalvingRandomSearchCV, a Scikit-learn implementation of Hyperband, to tune the following hyperparameters of our XGBoost classifier:
- Total Number of Estimators (n_estimators): Gradient boosting improves accuracy by sequentially adding trees to correct prior errors. While more estimators generally enhance accuracy, an excessive number can lead to overfitting if learning rates and regularization are not properly managed.
- Tree Depth (max_depth): Limiting decision tree depth prevents overfitting by simplifying the model, favoring generalized over specialized decision paths.
- Learning Rate (learning_rate): A smaller learning rate slows learning, allowing incremental refinements, reducing overfitting, and improving robustness, particularly with more estimators.
- Subsampling Ratio (subsample): Determines the training data fraction per tree. A subsample ratio under 1.0 trains each tree on a random data subset, reducing variance and preventing overfitting.
- Regularization: To bolster generalization and mitigate overfitting to the specific characteristics of the training data, two regularization techniques are utilized:
- reg_alpha (L1): Promotes sparsity by pushing less important feature weights to zero, filtering noise.
- reg_lambda (L2): Penalizes large coefficients, promoting smoother predictions by distributing feature importance.
A summary of the selected hyperparameters is provided below:
*subsample: We use the complete training dataset for each tree, maximizing information per iteration and improving stability. However, this raises the risk of overfitting without proper regularization.
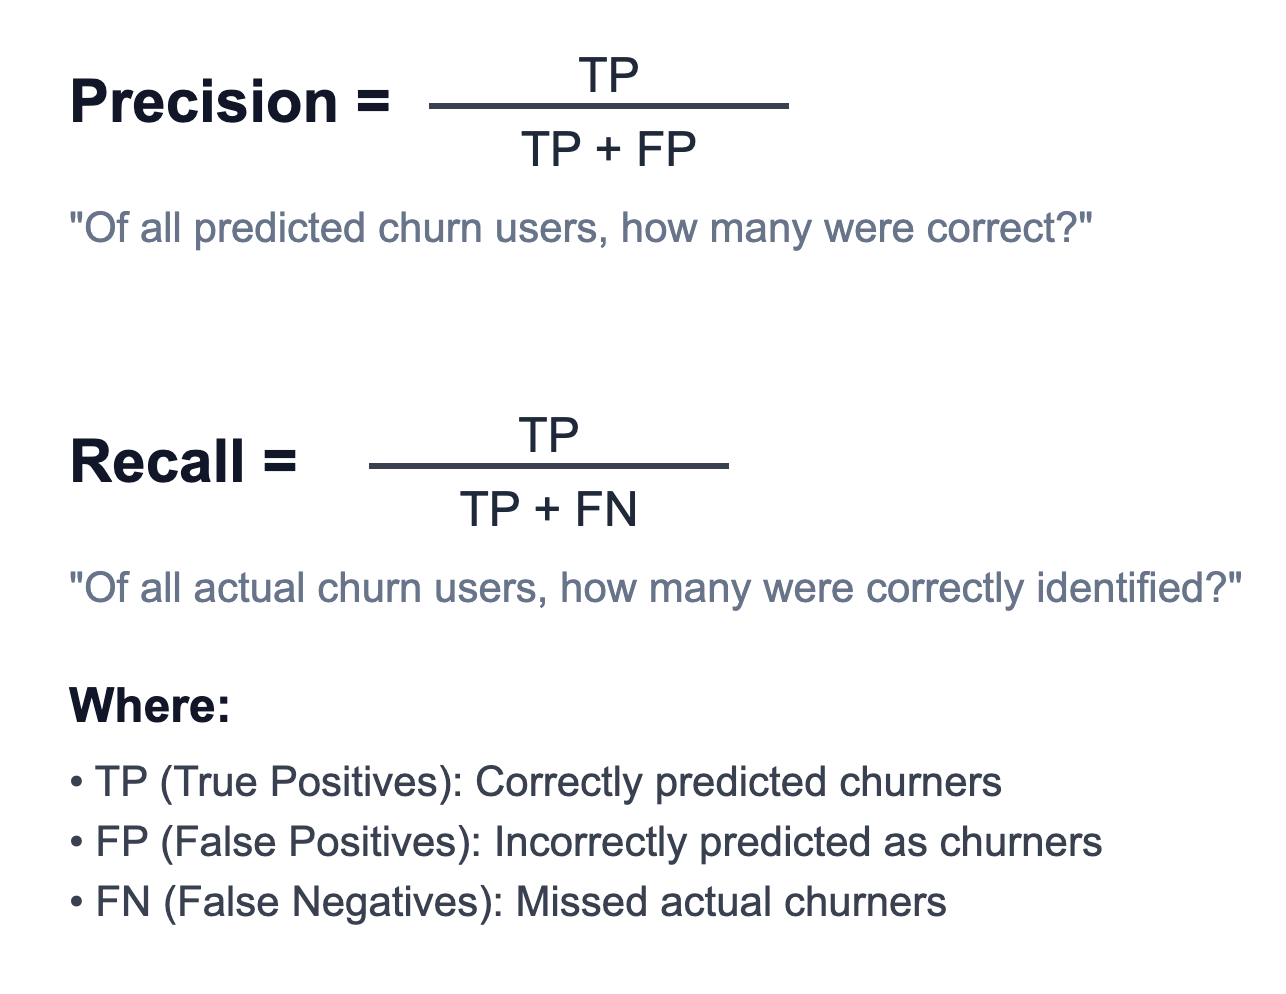
We selected Precision-Recall Area Under the Curve (PR AUC) as our performance metric for hyperparameter tuning, as it is particularly well-suited for imbalanced datasets like ours. First, let’s define the precision and recall metrics for our classification problem.
The PR AUC metric measures model performance on a scale from 0 to 1, representing the average precision achieved across different recall thresholds by summarizing the precision-recall curve. A perfect score of 1 indicates flawless churn prediction with no false positives, while a score near the baseline churn rate indicates random performance. Higher PR AUC values demonstrate superior model discrimination, more accurate identification of actual churners, with fewer misclassified non-churn stable customers.
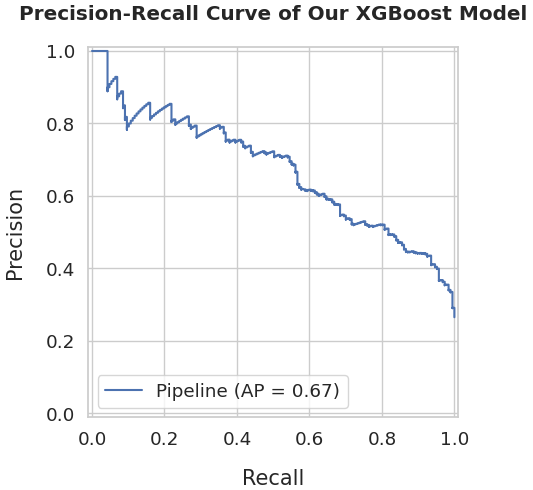
The model achieved a PR AUC score of 0.67, demonstrating solid predictive performance. This score reflects the model's ability to accurately identify at-risk customers while maintaining precision, correctly flagging users likely to churn without generating excessive false positives that would lead to unnecessary retention efforts targeting stable customers.
Performance Analysis and Interpretability
Performance metrics
The subsequent confusion matrix provides a concise overview of the model's efficacy, illustrating its ability to differentiate between customers who churn and those who remain. From this matrix, the precision and recall can be obtained, offering a thorough understanding of the model's predictive accuracy regarding customer churn.
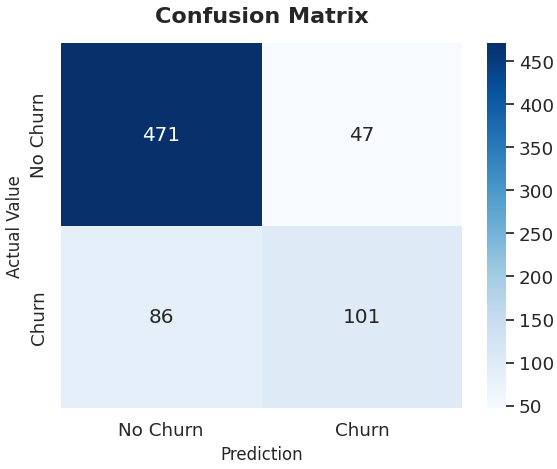
- Precision (68%): The model accurately identifies at-risk customers, correctly flagging approximately two-thirds of predicted churners. However, the remaining 32% false positive rate indicates room for improvement. Enhanced precision would minimize unnecessary retention interventions targeting stable customers, optimizing resource allocation, and reducing operational costs.
- Recall (54%): The model identifies only half of the actual churners, missing 46% of customers who will eventually leave. This represents a significant opportunity cost, as undetected churners cannot benefit from retention efforts. Improving recall is critical for maximizing revenue protection and customer lifetime value preservation.
Overall, the model performs reasonably well in identifying customers at risk of churn, which is valuable for developing retention strategies. However, there's an opportunity to improve its ability to capture a greater number of churners. Focusing on improving the recall for churners is vital, as this directly contributes to retention efforts and minimizes the loss of valuable customers.
SHAP Values for Interpretability
SHAP (SHapley Additive exPlanations) values are a game theory-based method for explaining machine learning model outputs. They quantify each feature's contribution to individual predictions by measuring how much each feature pushes the prediction above or below the average baseline prediction. This approach explains individual customer predictions, reveals global feature importance patterns, and provides model transparency for strategic decision-making.
The SHAP summary plot provides a comprehensive view of feature contributions across all predictions. Features are ranked by importance from top to bottom, with the most influential churn predictors appearing at the top. Each dot represents an individual customer, showing how that specific feature value affected their churn prediction compared to the model's average output.
- The position of the dot along the x-axis (SHAP value) reflects the impact that feature had on the prediction; values to the right increase the likelihood of churn, while those to the left decrease it.
- Color plays an important role, too. Dots are color-coded to represent the actual value of the feature for that customer — red means the feature has a high value, and blue means a low value. In the case of categorical features that were one-hot encoded (like “Yes”/“No”), red refers to "Yes" (or 1) and blue to "No" (or 0) in the encoding.
Well-defined patterns in the plot — for instance, when red and blue dots are separated on the x-axis — suggest that the feature alone has strong predictive power. In contrast, a mixture of red and blue across the SHAP value range may indicate the presence of interactions with other variables.
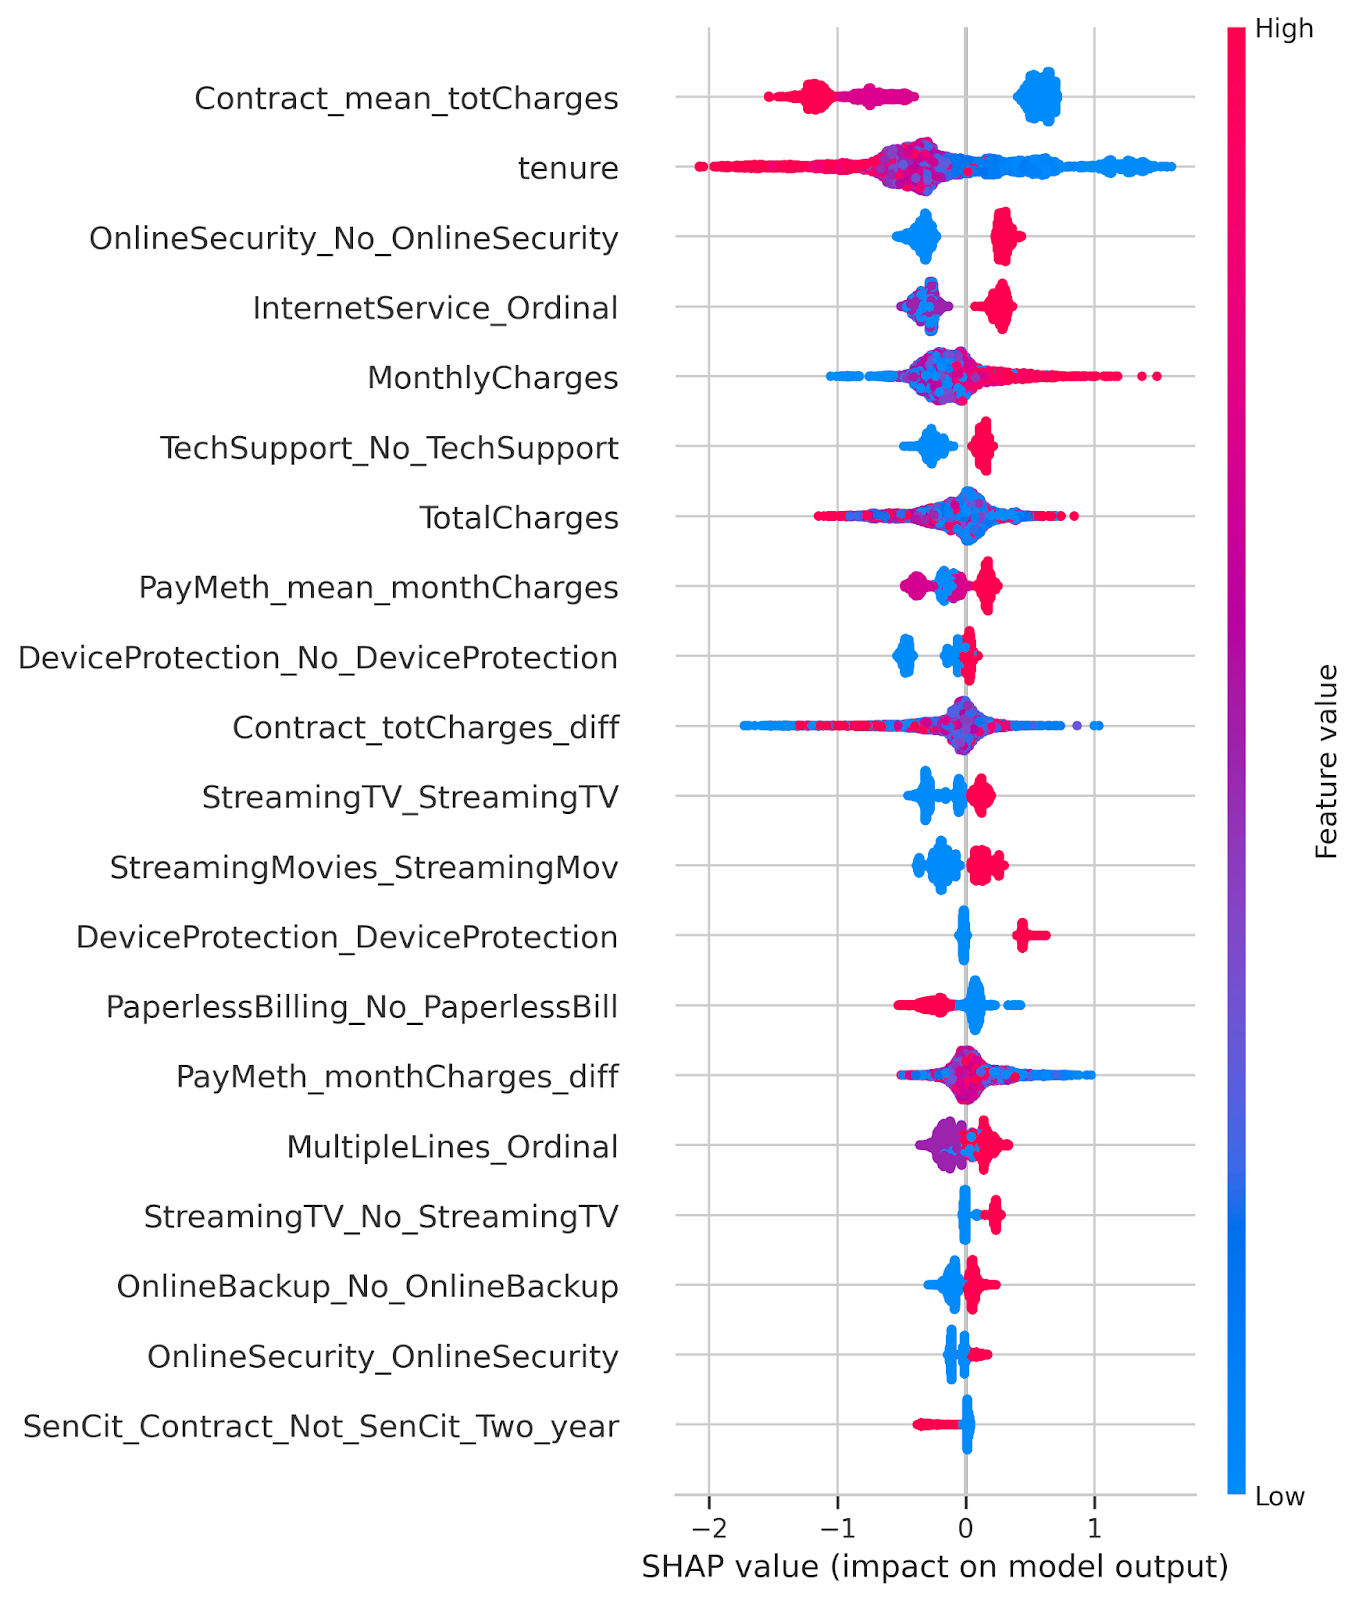
From the SHAP summary plot, we can extract several key insights about which factors most influence the model’s churn predictions.
- Contract_mean_totCharges is the most impactful feature. Higher total charges (red, left) correlate with lower churn, indicating committed, "locked-in" customers. Conversely, lower charges (blue, right) are linked to higher churn.
- Tenure closely follows, showing a similar pattern: longer-tenured customers (red, left) are more likely to stay, while shorter-tenured ones (blue, right) tend to churn. This highlights how loyalty and satisfaction increase over time, reducing the likelihood of departure.
- Service features are key churn predictors. Lacking online security and tech support strongly correlates with churn, while customers with these services are more likely to stay, possibly due to higher engagement or socioeconomic status.
- Elevated monthly expenditures are associated with a greater likelihood of churn, potentially attributable to discontent with pricing.
Together, these patterns reveal not just what features are important but how they influence predictions, helping businesses take targeted, actionable steps to retain at-risk customers.
Conclusions
We developed a machine learning model to predict customer churn using behavioral, service-related, and demographic features. Our XGBoost solution achieved a PR AUC of 0.67 while incorporating SMOTE for class imbalance, Hyperband for hyperparameter optimization, and SHAP for model interpretability.
The model enables proactive customer retention by identifying high-risk customers and revealing key churn drivers. This allows Customer Retention teams to implement targeted interventions as personalized incentives, enhanced support, or contract adjustments, rather than broad campaigns.
The business impact is substantial: since acquiring new customers costs significantly more than retention, our predictive approach transforms reactive churn management into a data-driven strategy that reduces attrition, improves satisfaction, and optimizes retention budgets. For subscription-based businesses, mitigating churn is critical for maintaining and growing Annual Recurring Revenue (ARR), as retained customers provide predictable revenue streams and higher lifetime value.
At Digital Sense, we specialize in helping companies turn raw data into strategic business decisions using the latest advancements in machine learning and artificial intelligence. We'd be excited to support your journey if you're looking to implement a churn prediction system or any other customer intelligence solution. Our team can help you uncover hidden patterns in your data, design tailored ML pipelines, and deploy models that generate real business value.
Need help implementing churn prediction in your business?
Reach out to Digital Sense today and let’s unlock your customer insights together.
📍 Our Services:
See how we help our clients thourgh our machine learning development services at www.digitalsense.ai
📞 Schedule a call:
For decision-makers looking to optimize your data and AI strategies, Digital Sense offers full-cycle consulting, from prototype to production-grade deployment. Contact us
Research Driven, Results Focused. That’s Digital Sense.